Matlab only supports 7 color strings, which are:
'blue', 'green', 'red', 'cyan', 'magenta', 'yellow' and 'black'.
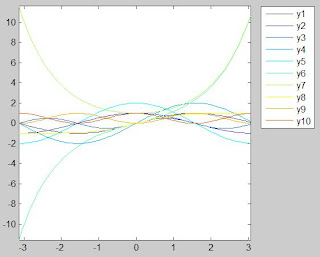
But very often we need to plot more than 7 data sets in one single plot. One solution is to repeat the colours and then use another type of marker. However it is desirable to have more than 7 colours for plotting. This is possible by using the built-in colourmaps in Matlab. For example:
x = -pi:.1:pi;
y1 = sin(x);
y2 = cos(x);
y3 = sin(x).*cos(x);
y4 = 2*sin(x);
y5 = 2*cos(x);
y6 = sinh(x);
y7 = cosh(x);
y8 = tanh(x);
y9 = (sin(x)).^2;
y10 = (cos(x)).^2;
% now generate 10 different colours from blue to red
colorRange = jet(10);
figure;
plot(x,y1,'Color',colorRange(1,:));
hold on; plot(x,y2,'Color',colorRange(2,:));
hold on; plot(x,y3,'Color',colorRange(3,:));
hold on; plot(x,y4,'Color',colorRange(4,:));
hold on; plot(x,y5,'Color',colorRange(5,:));
hold on; plot(x,y6,'Color',colorRange(6,:));
hold on; plot(x,y7,'Color',colorRange(7,:));
hold on; plot(x,y8,'Color',colorRange(8,:));
hold on; plot(x,y9,'Color',colorRange(9,:));
hold on; plot(x,y10,'Color',colorRange(10,:)); legend('y1','y2','y3','y4','y5','y6','y7','y8','y9','y10','Location','NorthEastOutside'); axis tight;
 The code above used the 'jet' colormap. Other built-in colormaps in Matlab are: 'autumn', 'bone', 'colorcube', 'cool', 'copper', 'flag', 'gray', 'hot', 'hsv', 'line', 'pink', 'prism', 'spring', 'summer', 'white', and 'winter'.
0 comments:
Post a Comment